
The Subway Subway
So...what was this?
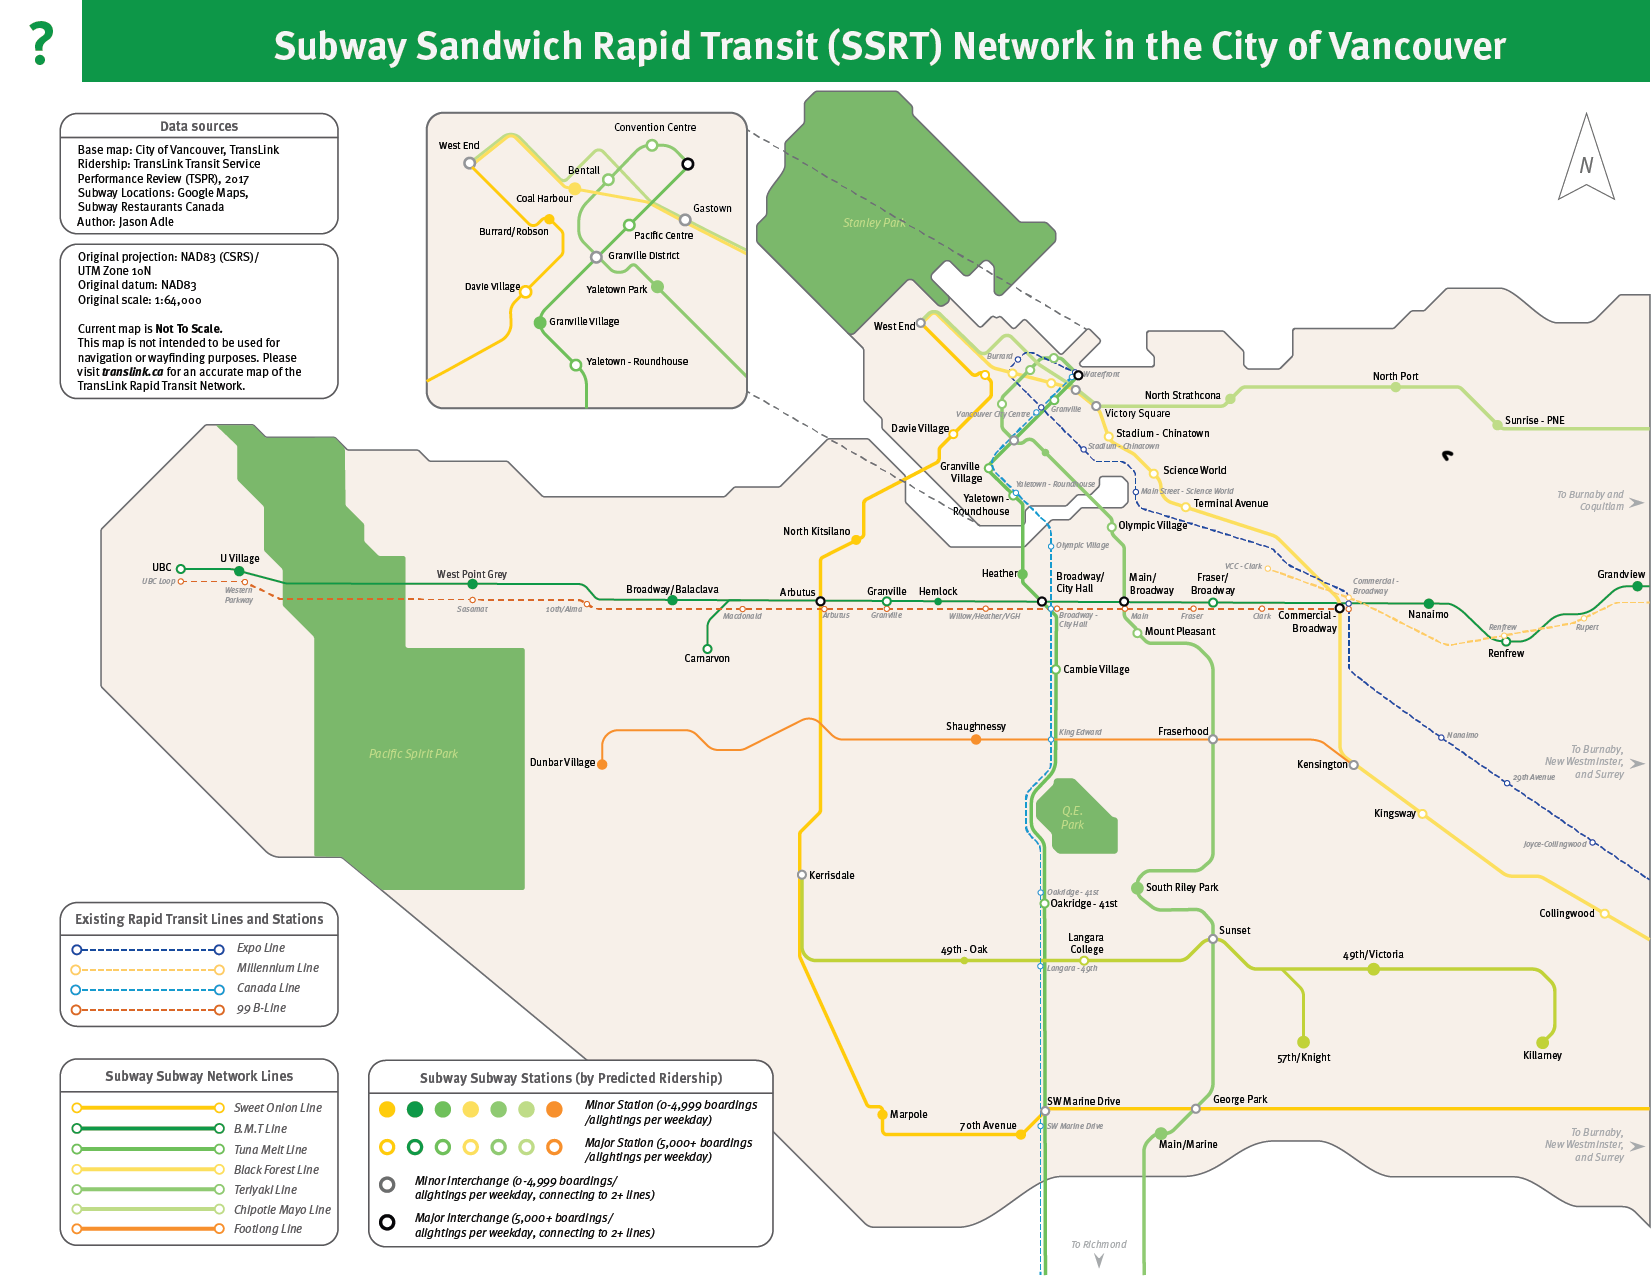
As part of my final project for GEOB 372 at the University of British Columbia, I was tasked with creating a map for any topic of my choosing that reflected all that I had learned throughout the course. I opted to do my final project of a "Subway Subway" (or in other words, a subway/metro/rapid transit system for the City of Vancouver, with stations based solely on the locations of Subway sandwich restaurants).
Why?
I will admit, it did start off as a bit of a meme. Many urbanist commentators in North America noted that the density of certain chain restaurants/cafes within a city, when combined to represent the stops and stations of a transit network, often created a transit network that was more comprehensive in service distribution compared to the actual transit system in place.
Here's an article on CityLab detailing the concept in depth.
And another article on Curbed detailing the concept as well.
I hadn't seen one yet for the City of Vancouver, so I figured I'd give it a shot.
How?
There were a few steps involved in getting the parts needed for the map ready to go.
- Developing a base map of the City of Vancouver, including shorelines
- Plotting existing transit lines on the base map
- Getting the location of each and every Subway location within the City of Vancouver
- Getting statistics on the theoretical ridership of this "network"
- Creating the final base map and inputting it to Illustrator
- Making it look pretty
The first two bullet points were relatively simple; the City of Vancouver, like many cities, has an Open Data portal that contains all the data needed to make the base map in ArcGIS or QGIS.
The third bullet, however, would prove a bit trickier. I initially emailed Subway Canada to ask if they happened to have a spreadsheet on hand, to no avail. The local health authority, Vancouver Coastal Health, had a Food Asset Map available that I used in a previous project, but this would not prove helpful either. In the end, I did it the old fashioned way: plotting it out on Google's My Maps. You can see the resulting map here. I've also embedded it just below.
I then had to export this dataset to something ArcGIS could recognize, which took some trial and error, but after repeated attempts with a plethora of software suites and web converters, I figured it out. I finally had a working base map with which I could proceed forward with in Illustrator.
I also had to gather some data that would "change" according to a parameter on the map; in my case, it was the type of station "dot" that changed based on the predicted ridership of a station. To do this, I referenced the data available in the Transit Service Performance Review published yearly by TransLink (the multimodal transportation authority in Metro Vancouver).
Finally, it was time to make it look pretty.
I had several avenues to go about it: I could make a design that was more "geographically accurate", including to-scale distances and shoreline curves, or I could opt for something that was closer to the schematic; I opted for the latter. Thankfully I had a map I could somewhat base my design off of: the TransLink Fast and Frequent Transit Network map (although it was previously just called the Rapid Transit network map prior to January 2020 introduction of the RapidBus network).

The font TransLink uses in its signage and maps is Meta OT and I based the visual language and "base colors" off that map. The colors I used in my map for the lines (as well as the line names) were created by my own mind. I chose to reference particular sandwiches, sandwich fillings, and the illustrious Footlong sub as part of the nomenclature. Line dots varied in style and size based on the predicted ridership as determined by annual boardings at the closest bus stop pairs to where the Subway was located and/or the closest SkyTrain or Canada Line station's annual boardings.